Here are some thoughts on one way to adjust your SDR and waterfall for “optimal” reception and viewing. This is my preferred style; there are others, but my hope is that these examples will help illustrate what each of the controls do and what the observable effects are. These examples use the AirSpy HF Discovery and SDRSharp, because I had them handy, but the same settings should be available to most SDRs and SDR software in some fashion.
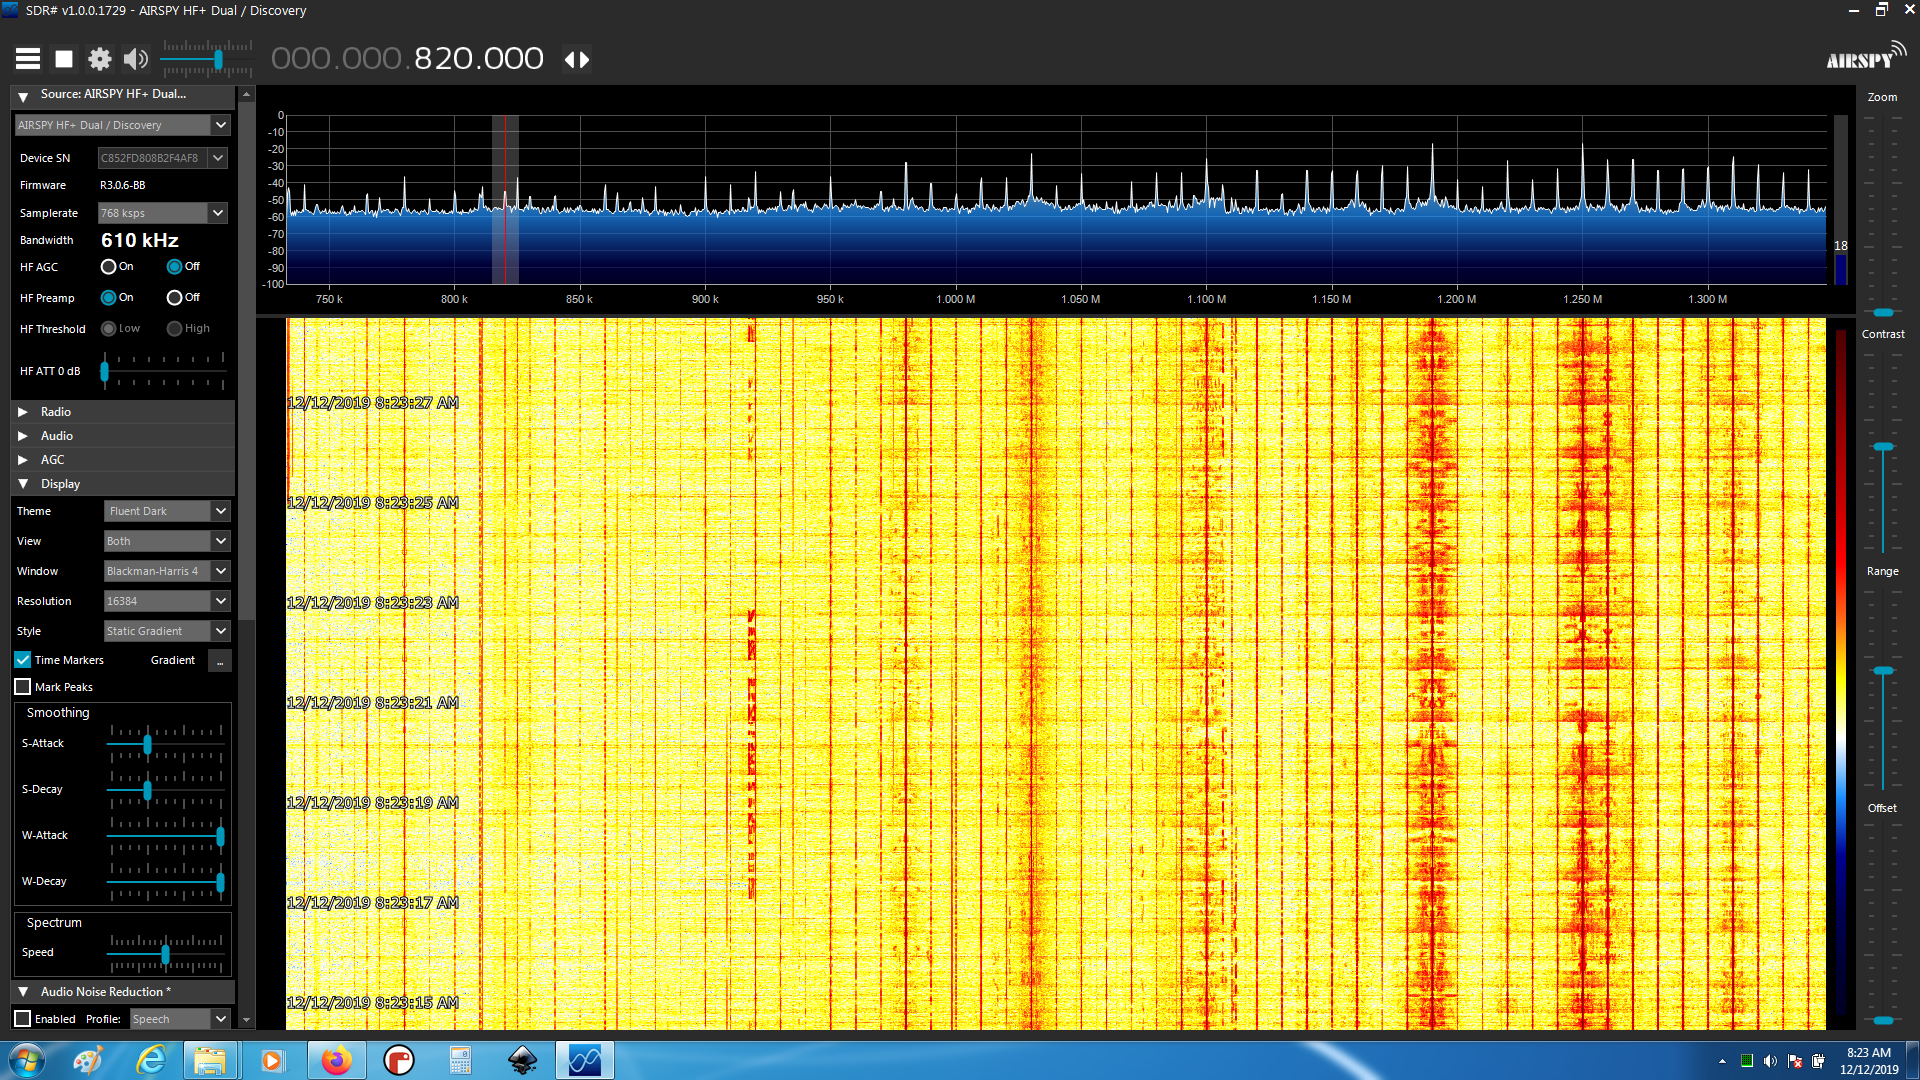
Image 01: This is more or less a “default” setup. The preamp is on, the attenuator is off, the waterfall contrast is visibly “high.” Full scale is 100dB, and the noise floor to the highest signal is only about 40dB. The waterfall is saturated and compressed, with very little variation in color between “noise floor” and “strongest signal.” The 10kHz channel at 820 kHz is highlighted, but there’s no signal to be seen.
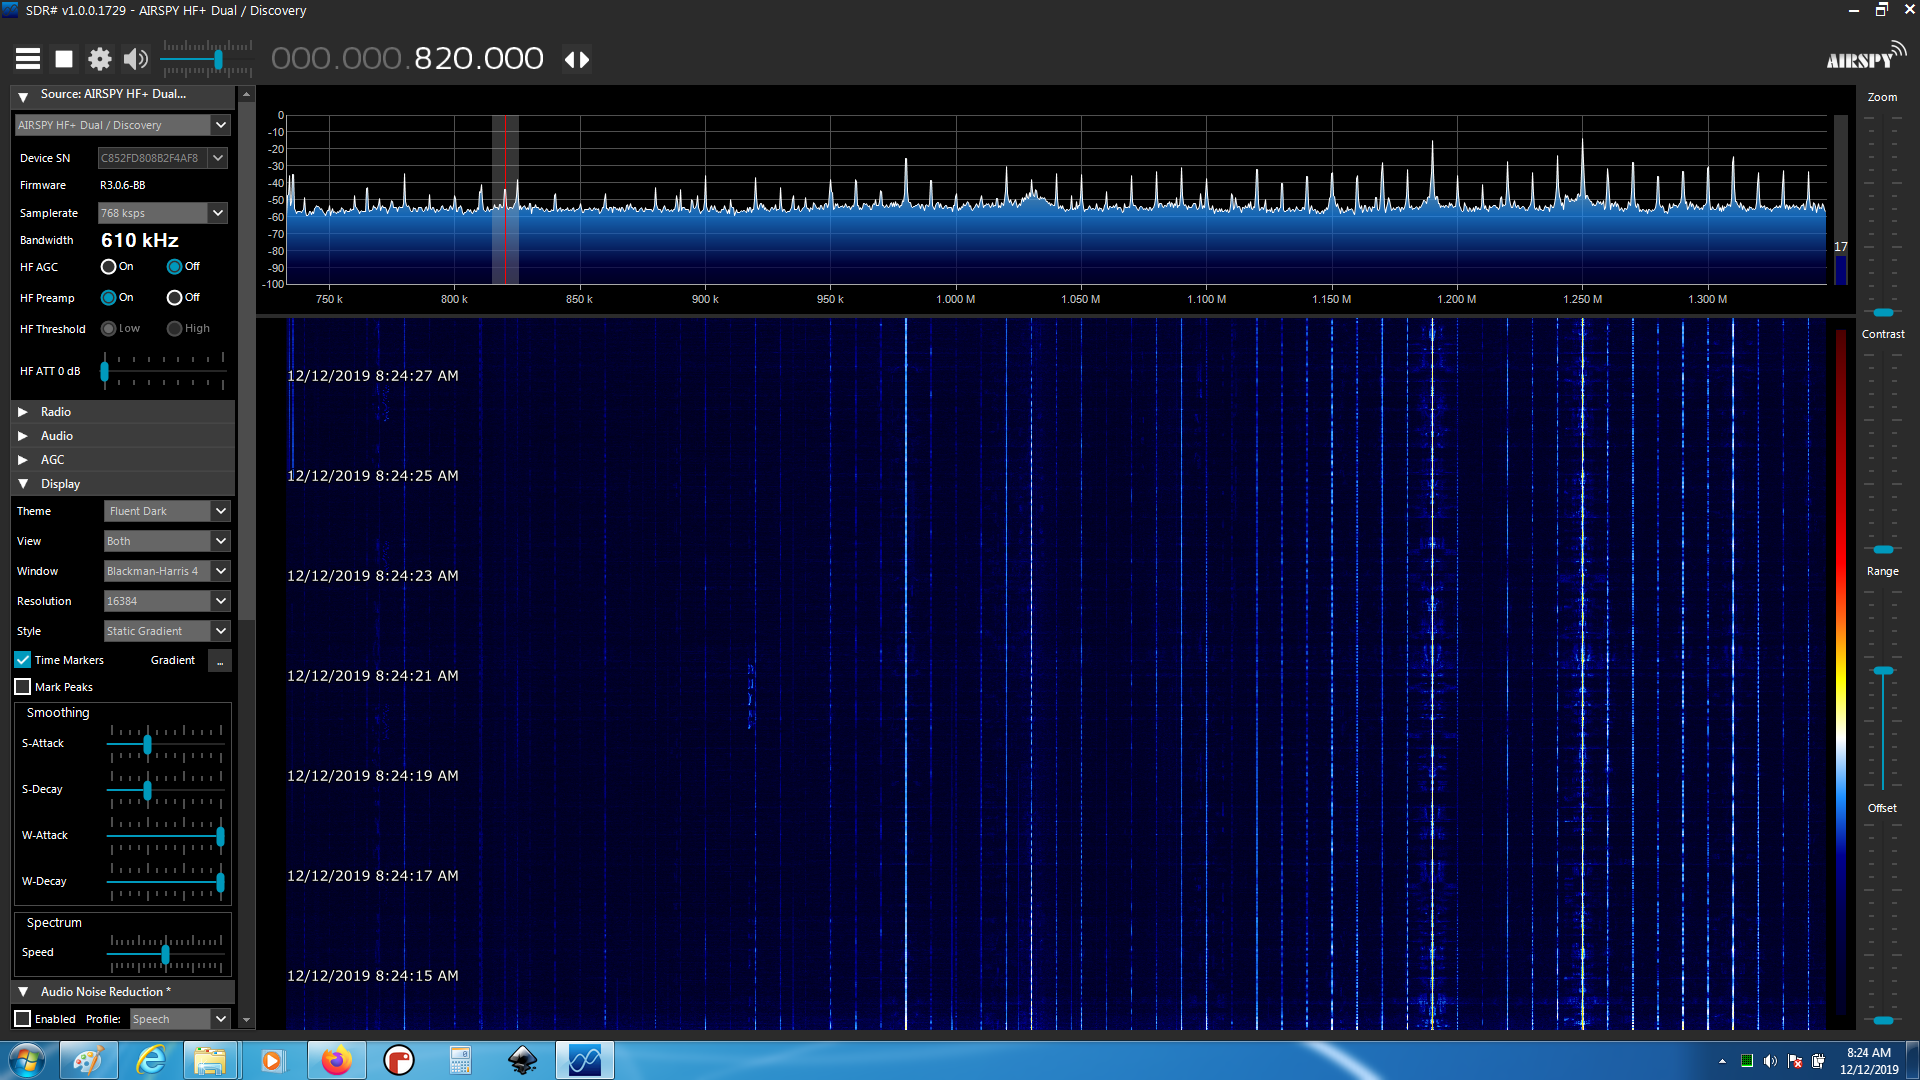
Image 02: We pull the “contrast” slider all the way down to minimum. We can see a lot more detail in the waterfall, but not heaps since the information is still compressed into the middle 40% of the display range as discussed in image 01. But, we can start to see the modulation of some stations.
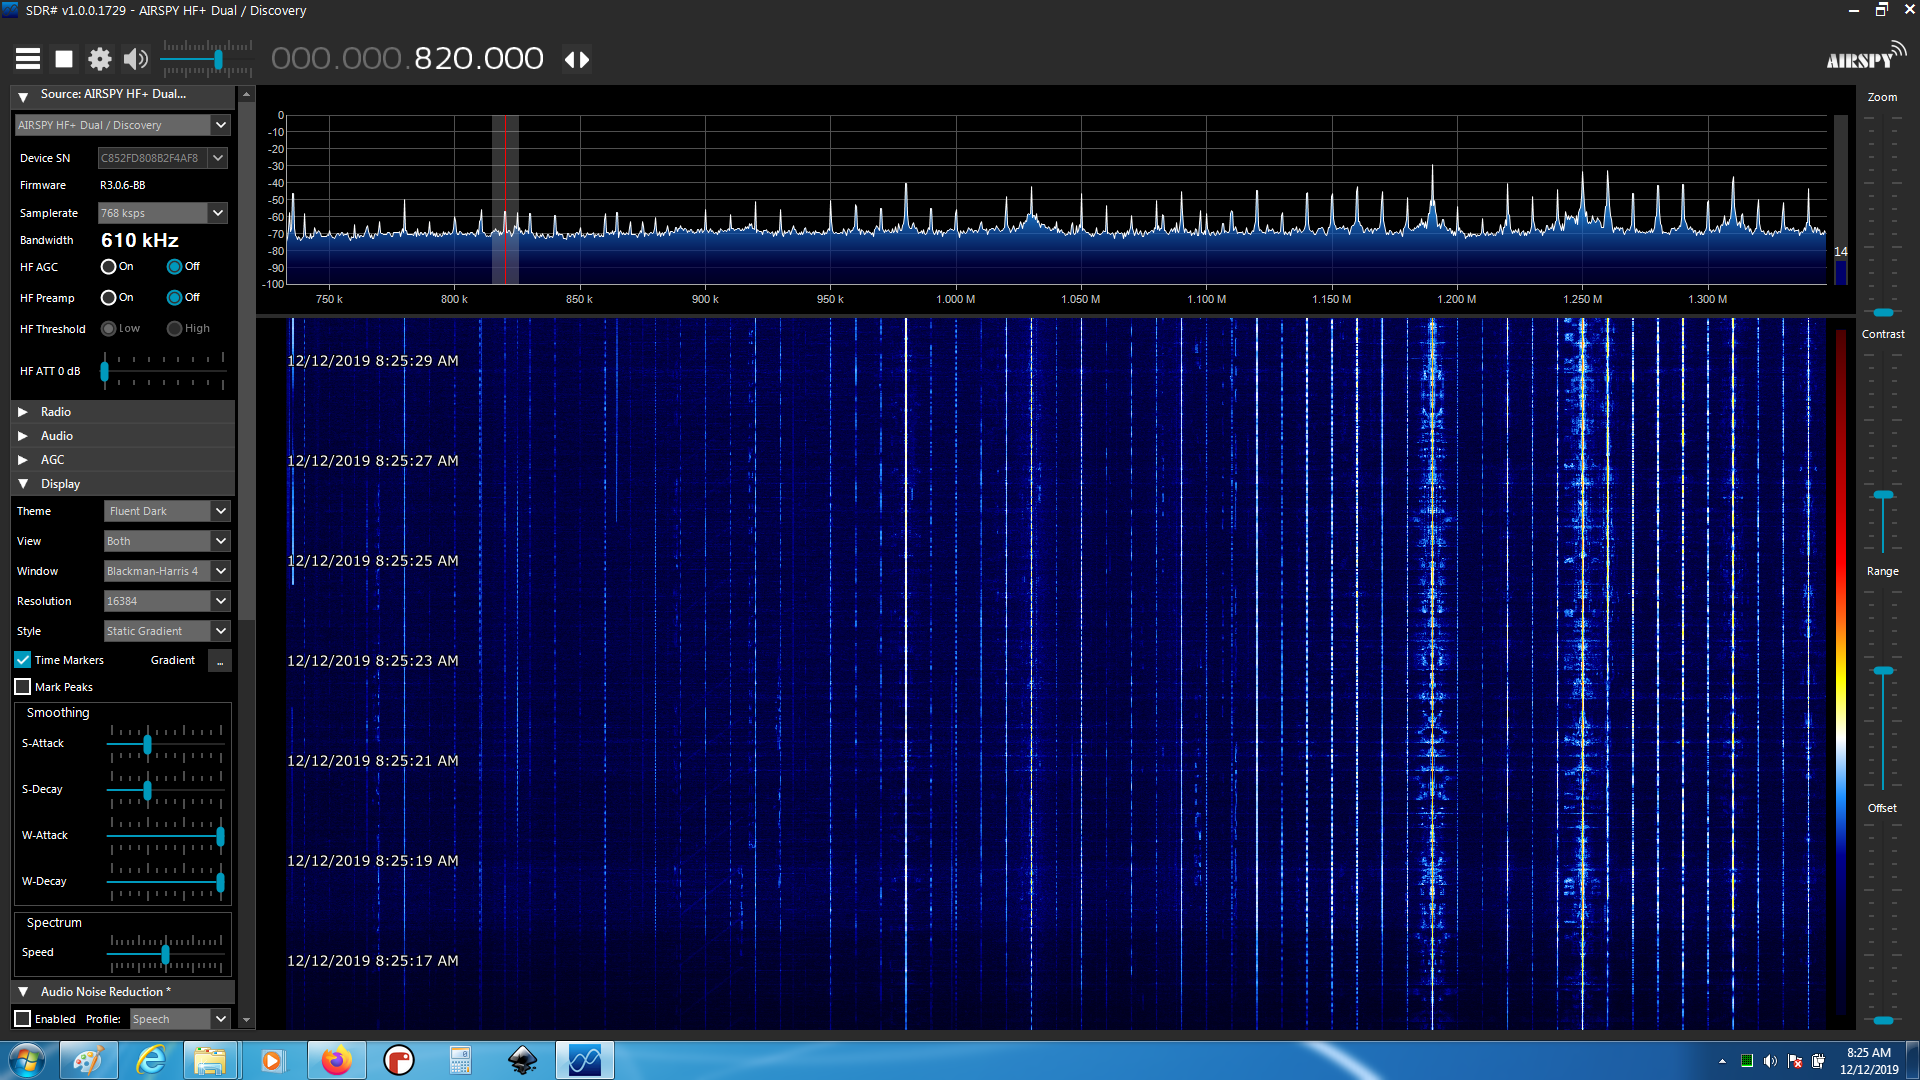
Image 03: Because we suspect there are signals we should be seeing but aren’t, and because we know there are some very loud signals nearby, we reduce the overall system gain by turning off the preamp. Also, we increase the ‘contrast’ slider a bit to keep the noise floor just barely visible in the waterfall. We can see a lot more detail in the waterfall, but we still don’t see anything at 820. We do see what looks like OTH radar at 900kHz though.
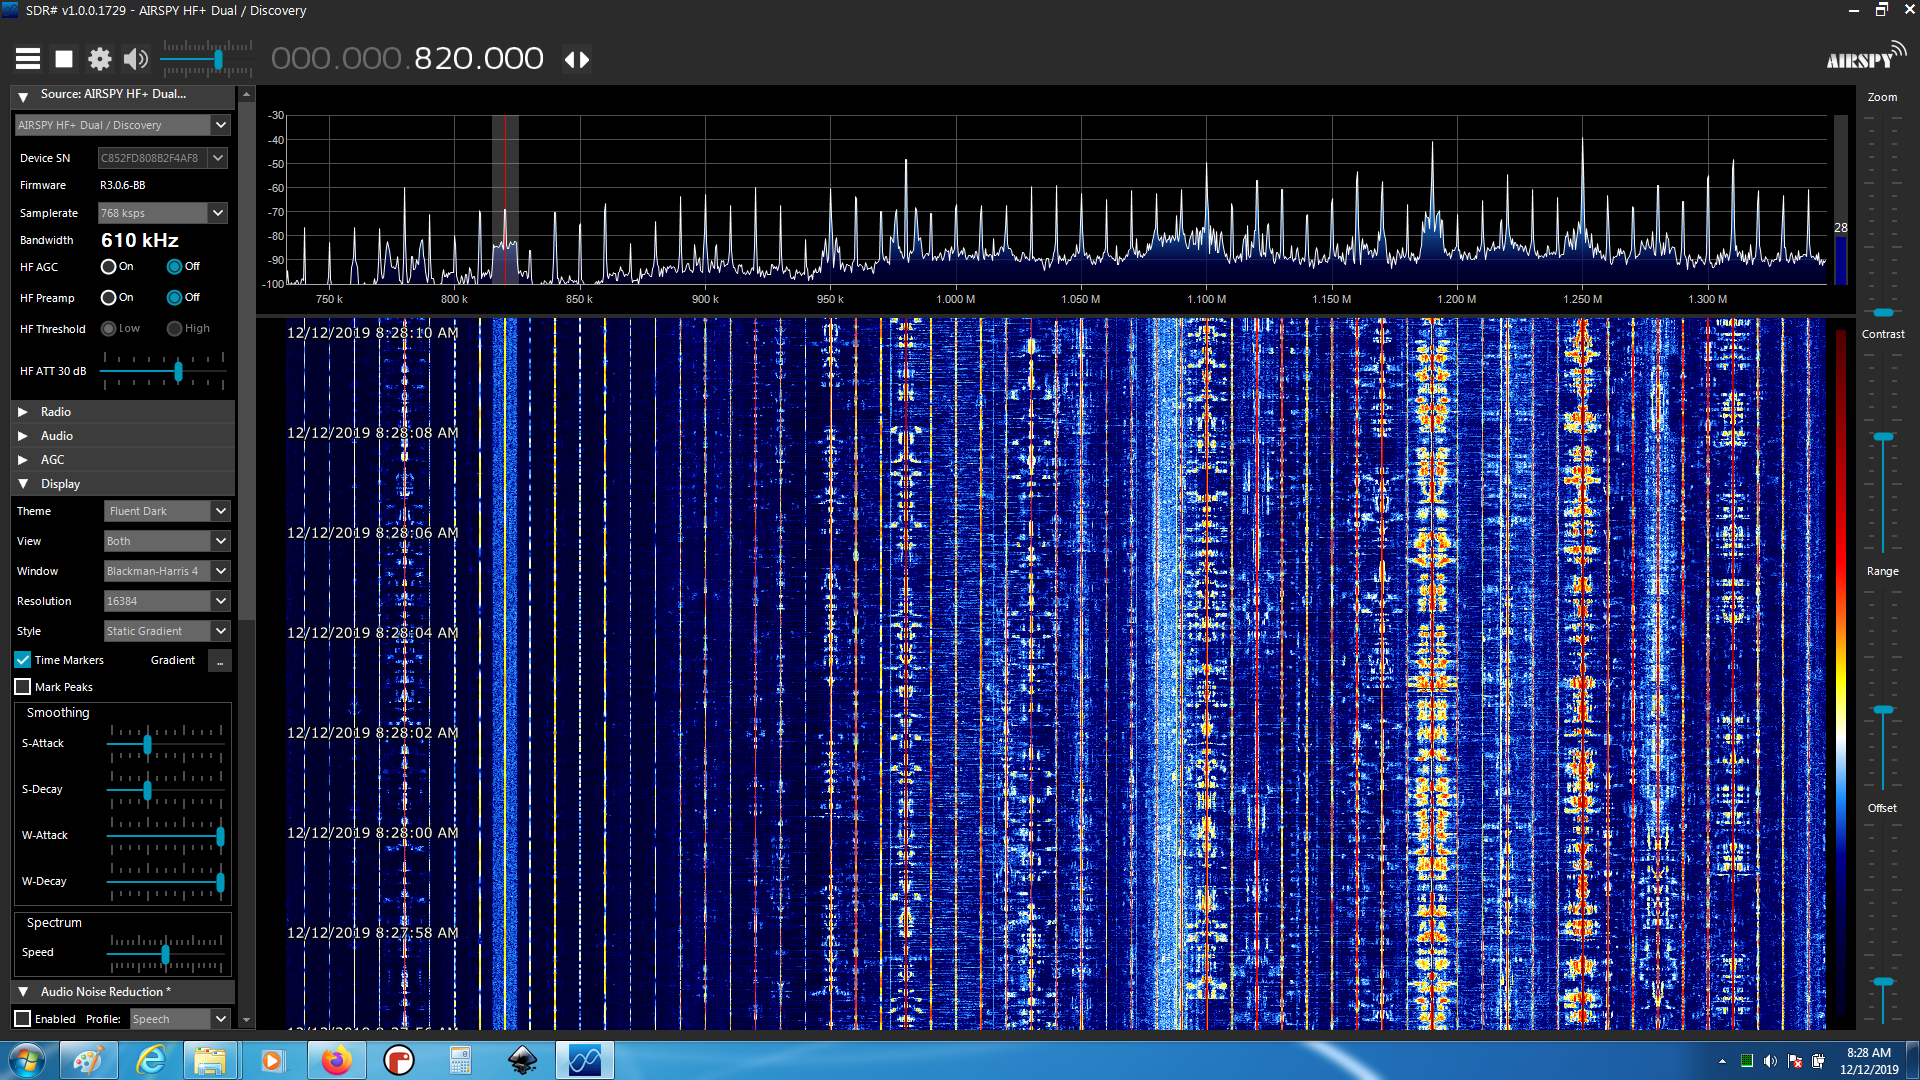
Image 04: In this image we’ve reduced the system gain by 30dB by turning up the HF ATT slider in the Source control panel. You could achieve the same effect with other SDRs by adding inline attenuators. Also, we’ve adjusted the RANGE and OFFSET sliders on the right to get the noise floor about at the bottom of the spectrum display range and the strongest signal at a comfortable margin from the top of the display. Now the display covers 70dB, and we can adjust the contrast again to keep the noise floor just visible as speckles in the waterfall. Now we can see our 820 station! Amazing that 30dB of attenuation would bring a signal out of the noise, but there you go. There is also a lot more detail visible for a lot more stations in the waterfall now, including what looks like another digital signal in the lower sideband of 1100.

Image 05: Now to zoom in on our signal of interest at 820kHz. We’ve adjusted the zoom to narrow the frequency range displayed, increased the FFT point count to get better resolution, slowed the attack/decay of the spectrum display to get a better “long term” feel for the signal characteristics, and adjusted the range and offset to center the information in the vertical axis. Note in this image we didn’t adjust the contrast, but if we did we might see more details.
ALSO, note that in SDR# if you hover over the receiver bandwidth, you’ll get some signal statistics. Note that the SNR is from the noise floor to the highest peak, which for AM is the central carrier, which is NOT a useful measurement for determining how much SNR you have for your digital signal. We can fix that.
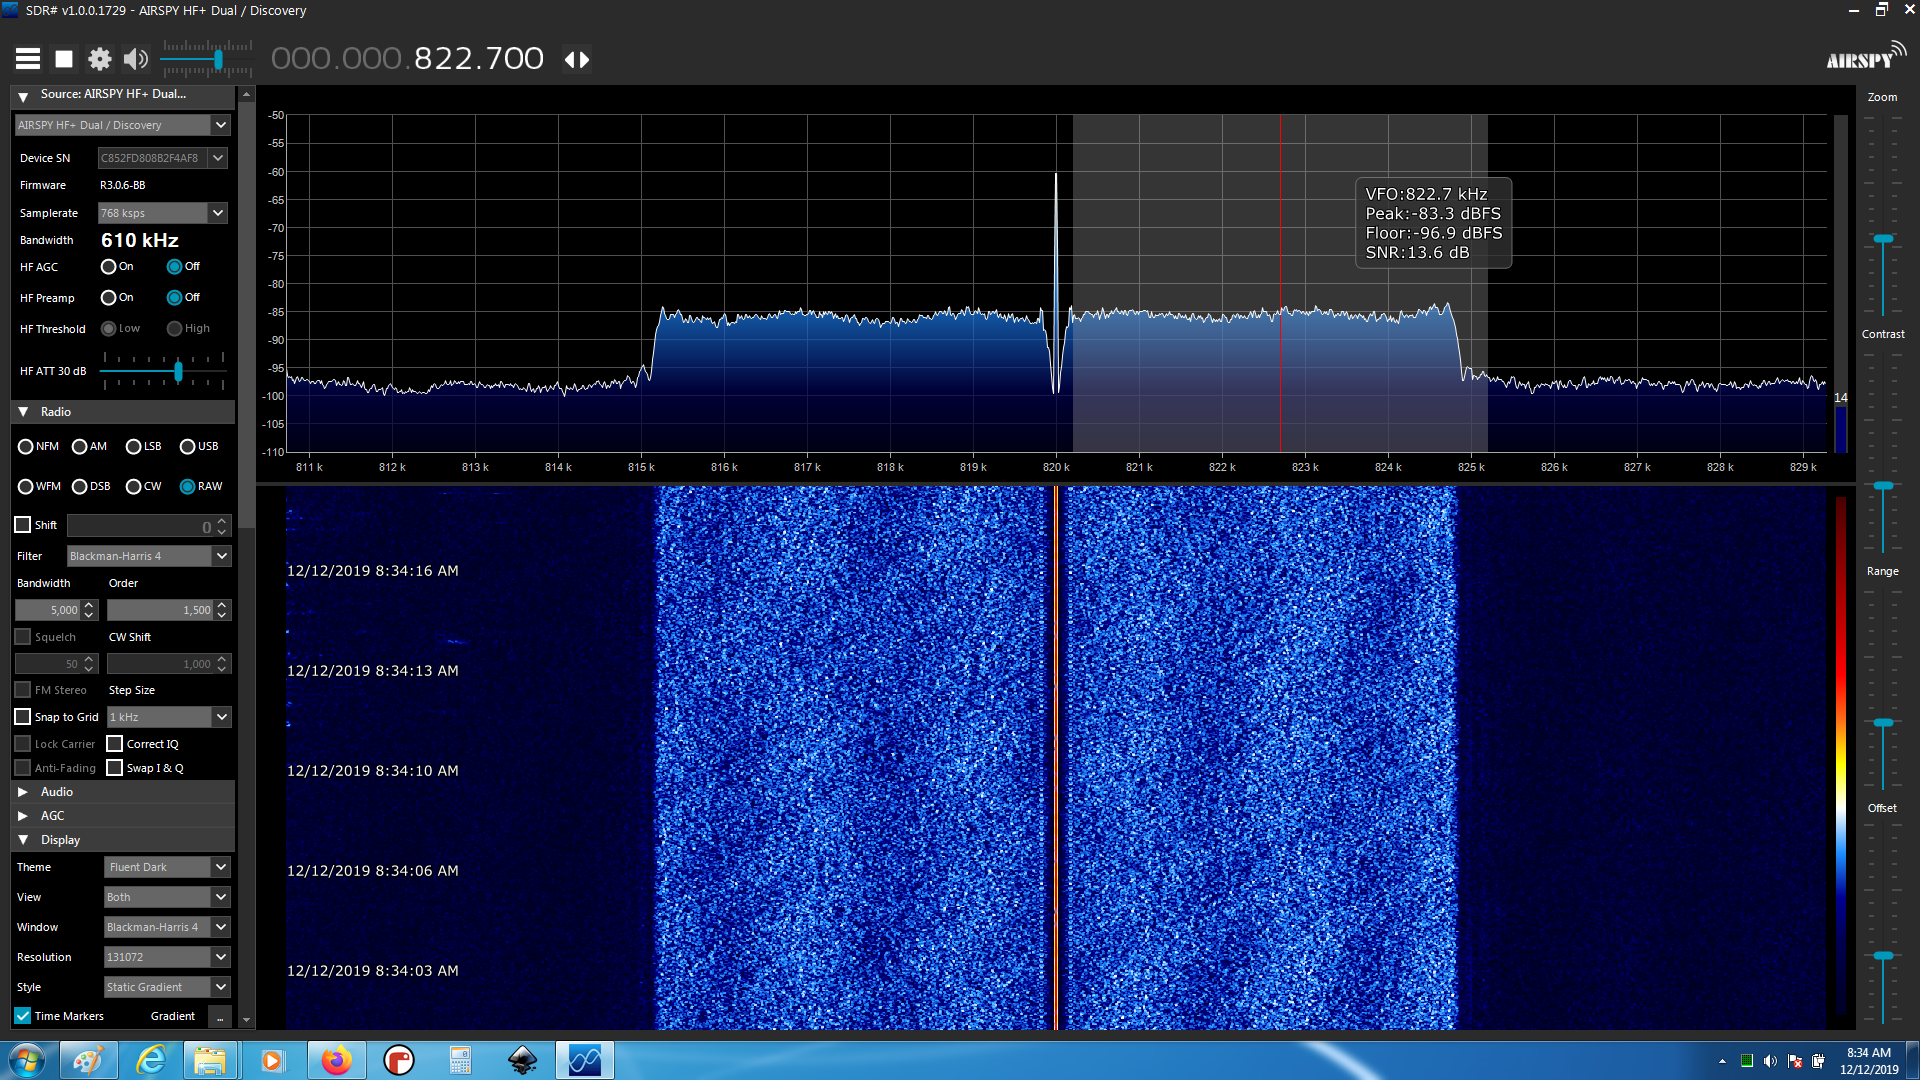
Image 06: Here we have adjusted the contrast and receiver bandwidth and moved the receiver window away from the AM carrier peak for the purposes of doing a measurement (although demodulation would certainly suffer). The reported SNR of the non-carrier portion of the signal is a much more realistic 13.6dB. Note that the Peak and Floor are dbFS, or db with respect to the Full Scale setting of the display, so those are useful only for relative measurements from the same reference point.